Fig. 6
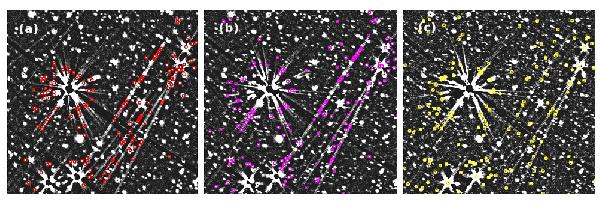
Close-up views of a sample region around bright sources showing false detections at each NIR band caused by MUX-bleeding trails before the correction. The left, middle, and right panels show the N2, N3, and N4 band images, respectively. Colored circles indicate the objects that were not matched with optical data.
Current usage metrics show cumulative count of Article Views (full-text article views including HTML views, PDF and ePub downloads, according to the available data) and Abstracts Views on Vision4Press platform.
Data correspond to usage on the plateform after 2015. The current usage metrics is available 48-96 hours after online publication and is updated daily on week days.
Initial download of the metrics may take a while.