Fig. 26
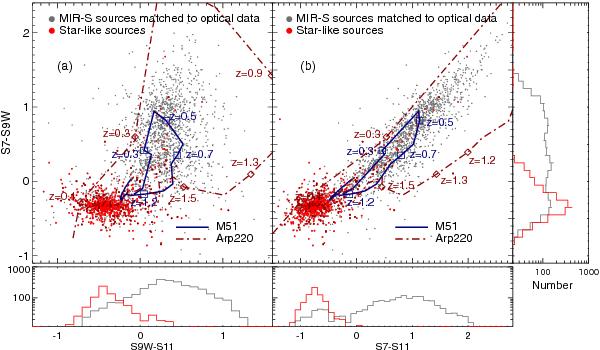
Color–color diagrams of the NEP-Wide MIR source matching with optical data. a) (S7 − S9W) vs. (S9W − S11) and b) (S7 − S9W) vs. (S7 − S11) color–color diagrams. All of the MIR sources having optical counterparts are presented using dark dots in the diagrams. Among them, the star-like sources defined as those with stellarity greater than 0.8 are indicated by the red histogram.
Current usage metrics show cumulative count of Article Views (full-text article views including HTML views, PDF and ePub downloads, according to the available data) and Abstracts Views on Vision4Press platform.
Data correspond to usage on the plateform after 2015. The current usage metrics is available 48-96 hours after online publication and is updated daily on week days.
Initial download of the metrics may take a while.