Fig. 25
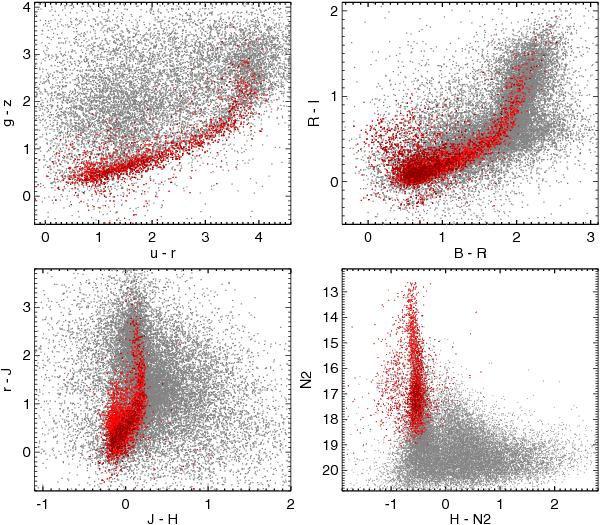
Color–color diagrams and color-magnitude diagram of the NEP-Wide sources matched with the optical data. They show the various colors by optical bands from the CFHT and Maidanak and the NIR J, H bands. Red dots represent the “star-like” sources defined as having stellarity >0.8 and r′ < 19.
Current usage metrics show cumulative count of Article Views (full-text article views including HTML views, PDF and ePub downloads, according to the available data) and Abstracts Views on Vision4Press platform.
Data correspond to usage on the plateform after 2015. The current usage metrics is available 48-96 hours after online publication and is updated daily on week days.
Initial download of the metrics may take a while.