Fig. 22
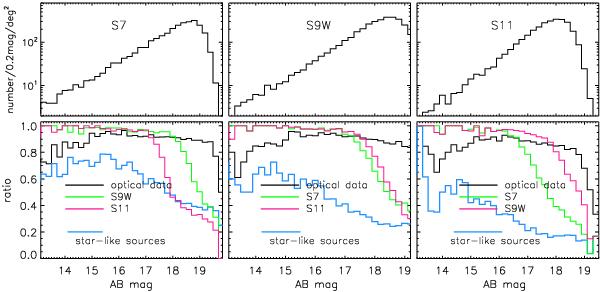
Same as Fig. 21, but for the MIR-S band sources. The top panel shows the number of sources per square degree per 0.2 mag bin as a function of magnitude. In the lower panel, the matching rates of the sources against those in the other MIR-S bands and the optical data are presented together with the fraction of star-like sources.
Current usage metrics show cumulative count of Article Views (full-text article views including HTML views, PDF and ePub downloads, according to the available data) and Abstracts Views on Vision4Press platform.
Data correspond to usage on the plateform after 2015. The current usage metrics is available 48-96 hours after online publication and is updated daily on week days.
Initial download of the metrics may take a while.