Fig. 16
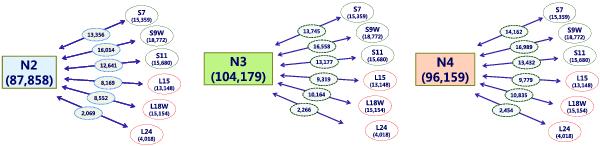
Schematic diagram showing the results of the matching between the sources in the NIR and MIR bands except for multiply matched sources. The matching results of the N2 sources with all the MIR bands are shown in the leftmost panel. The results for N3 and N4 bands are shown in the middle and the right panels, respectively.
Current usage metrics show cumulative count of Article Views (full-text article views including HTML views, PDF and ePub downloads, according to the available data) and Abstracts Views on Vision4Press platform.
Data correspond to usage on the plateform after 2015. The current usage metrics is available 48-96 hours after online publication and is updated daily on week days.
Initial download of the metrics may take a while.