Free Access
Fig. 12
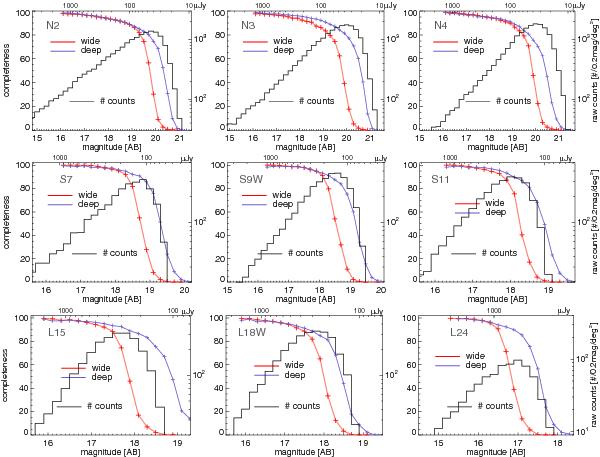
Completeness estimation for each band (red curves). The estimates for the NEP-Deep data are also shown for comparison. The gray histograms show the NEP-Wide source density per square degree per 0.2 mag bin at each band (not corrected for incompleteness).
This figure is made of several images, please see below:
Current usage metrics show cumulative count of Article Views (full-text article views including HTML views, PDF and ePub downloads, according to the available data) and Abstracts Views on Vision4Press platform.
Data correspond to usage on the plateform after 2015. The current usage metrics is available 48-96 hours after online publication and is updated daily on week days.
Initial download of the metrics may take a while.