Fig. 5
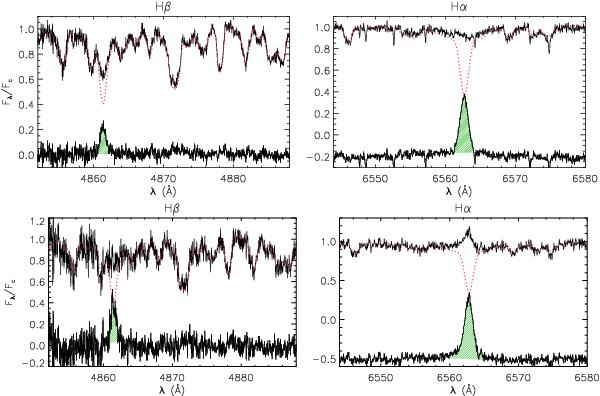
Top of each panel: observed, continuum-normalized FIES spectra of CoRoT 102899501 (solid line) acquired on 2010 October 10 (upper panels) and 2010 November 1 (lower panels) in the Hβ (left panels) and Hα (right panels) regions. The spectrum template of the non-active star is represented in dotted lines. Bottom of each panel: difference between observed and template spectra. The residual Hα profile is shifted downwards for the sake of clarity. The hatched areas represent the excess emissions that have been integrated to obtain the net line EW.
Current usage metrics show cumulative count of Article Views (full-text article views including HTML views, PDF and ePub downloads, according to the available data) and Abstracts Views on Vision4Press platform.
Data correspond to usage on the plateform after 2015. The current usage metrics is available 48-96 hours after online publication and is updated daily on week days.
Initial download of the metrics may take a while.