Free Access
Fig. 3
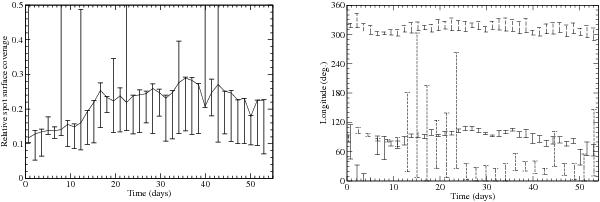
Time evolution of the total spot surface coverage (left) and active longitude (right) on CoRoT 102899501 derived from its lightcurve analysis using a three-spot model. The three sets of symbols on the right-hand side correspond to the three spots used in the model.
Current usage metrics show cumulative count of Article Views (full-text article views including HTML views, PDF and ePub downloads, according to the available data) and Abstracts Views on Vision4Press platform.
Data correspond to usage on the plateform after 2015. The current usage metrics is available 48-96 hours after online publication and is updated daily on week days.
Initial download of the metrics may take a while.