Fig. 1
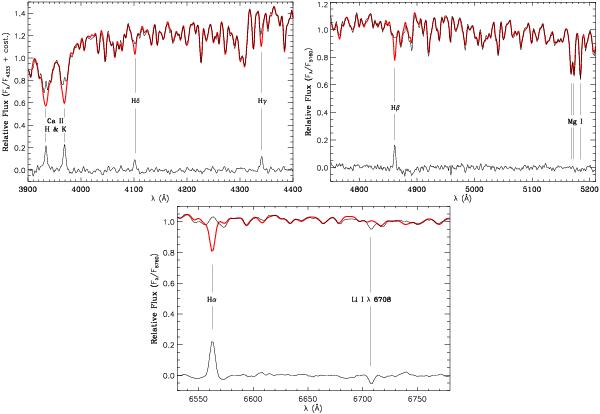
AAOmega spectrum of CoRoT 102899501 (thin line) in three different spectral regions, along with the best-fitting template overplotted (thick line). The spectra have been arbitrarily normalised to the flux reported in the title of the vertical axis. The differences between observed and best-fitting spectrum are displayed in the lower part of each panel. Emission in the Balmer and Ca ii H and K lines is detected, as well as a strong Li i λ 6707.8 Å absorption line, suggesting a young and active solar-like star.
Current usage metrics show cumulative count of Article Views (full-text article views including HTML views, PDF and ePub downloads, according to the available data) and Abstracts Views on Vision4Press platform.
Data correspond to usage on the plateform after 2015. The current usage metrics is available 48-96 hours after online publication and is updated daily on week days.
Initial download of the metrics may take a while.