Fig. 3
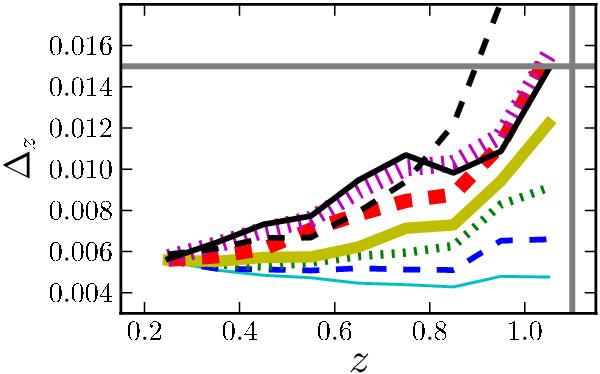
Δz as a function of redshift in the mass-selected sample, from M ⋆ ≥ 1011 M⊙ (thiner line) to 1010 M⊙ ≤ M ⋆ < 1010.2 M⊙ (thicker line) galaxies in bins of 0.2 dex. The black solid line marks the photometric errors of blue galaxies in the lower mass bin, while the black dashed line is for red galaxies in the same mass bin. The vertical line marks the higher redshift in our samples, zmax = 1.1. The horizontal line marks the median Δz for low-mass galaxies at the high redshift end of our sample 1.0 ≤ z < 1.1, Δz = 0.015.
Current usage metrics show cumulative count of Article Views (full-text article views including HTML views, PDF and ePub downloads, according to the available data) and Abstracts Views on Vision4Press platform.
Data correspond to usage on the plateform after 2015. The current usage metrics is available 48-96 hours after online publication and is updated daily on week days.
Initial download of the metrics may take a while.