Fig. 11
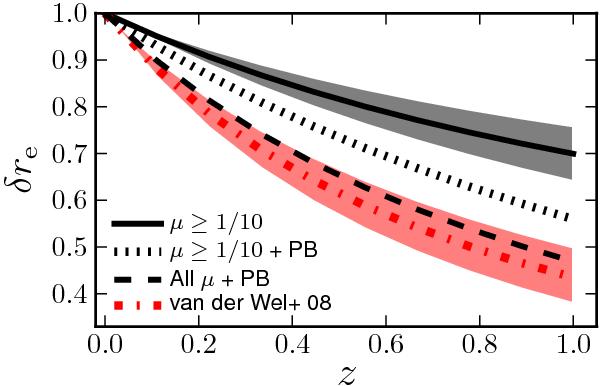
Effective radius normalised to its local value, δre, as a function of redshift. The dott-dashed line is the observational evolution from van der Wel et al. (2008), δre = (1 + z)-1.2. The solid line is the evolution due to major and minor mergers (μ ≥ 1/10) expected from our results. The shaded areas in both cases mark the 68% confidence interval. The dotted line is the expected evolution when the progenitor bias (PB) is taken into account. The dashed line is the expected evolution when PB and very minor mergers (μ < 1/10) are included (see text for details).
Current usage metrics show cumulative count of Article Views (full-text article views including HTML views, PDF and ePub downloads, according to the available data) and Abstracts Views on Vision4Press platform.
Data correspond to usage on the plateform after 2015. The current usage metrics is available 48-96 hours after online publication and is updated daily on week days.
Initial download of the metrics may take a while.