Free Access
Fig. 10
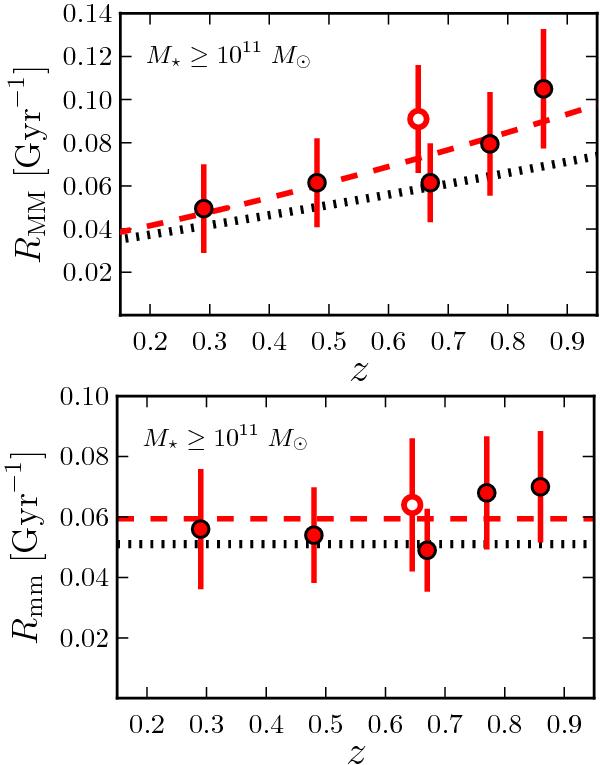
Major (upper panel) and minor (lower panel) merger rate of M ⋆ ≥ 1011 M⊙ ETGs as a function of redshift. Filled symbols are from the present work, while open ones are from LS11 in VVDS-Deep for red galaxies. Dashed lines are the best fit to the ETGs data, while dotted lines are the fits for the global population.
This figure is made of several images, please see below:
Current usage metrics show cumulative count of Article Views (full-text article views including HTML views, PDF and ePub downloads, according to the available data) and Abstracts Views on Vision4Press platform.
Data correspond to usage on the plateform after 2015. The current usage metrics is available 48-96 hours after online publication and is updated daily on week days.
Initial download of the metrics may take a while.