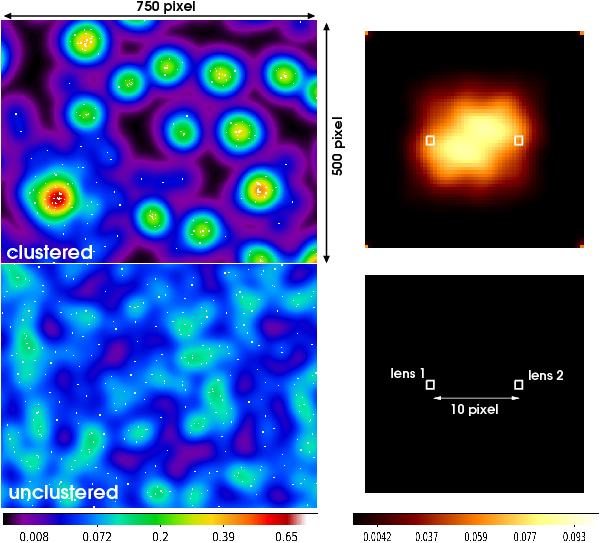
Fig. 3

Right panels: excess mass around lens pairs with fixed separation; squares indicate the lens positions inside the maps. Left panels: excerpts of the underlying ILM mock data: lenses, shown as little dots, are either clustered (top left) or randomly distributed on the sky (bottom left). For simplicity, every lens has the same individual matter halo with a Gaussian lensing convergence profile (rms size is 20 pixel) sticked to it. The clustered lens haloes produces the joint matter halo of galaxy clusters in this model. The intensity scale in the left panels depicts the combined lensing convergence of all lenses; this is probed as shear by a sample of source galaxies. Note that the angular scale or the shear amplitude are of no particular interest here. The bottom right panel is the actual measurement of the bottom left scenario with the colour scale of thetop right panel.
Current usage metrics show cumulative count of Article Views (full-text article views including HTML views, PDF and ePub downloads, according to the available data) and Abstracts Views on Vision4Press platform.
Data correspond to usage on the plateform after 2015. The current usage metrics is available 48-96 hours after online publication and is updated daily on week days.
Initial download of the metrics may take a while.


