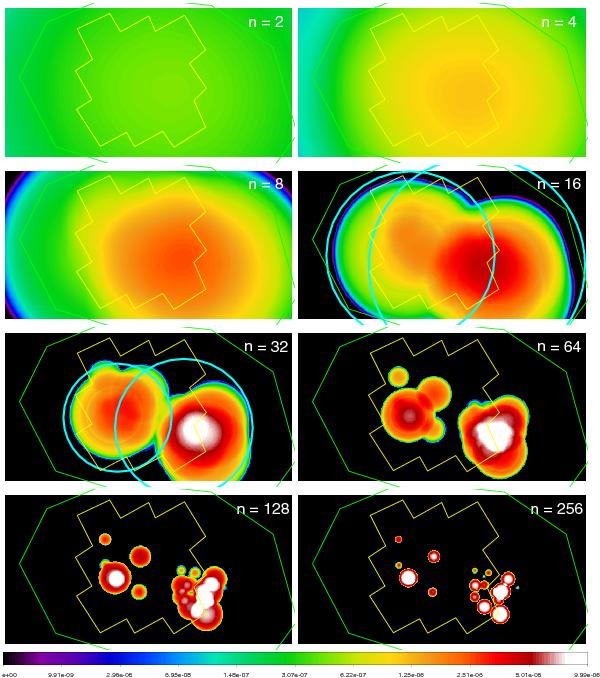
Fig. 9

[O iii]88 distribution modeled around each star with an homogeneous density ranging from 2 cm-3 to 256 cm-3. The yellow polygon indicates the PACS coverage and the green polygon indicates the approximate extent of the optical body. The cyan circles in the n = 16 and 32 cm-3 panels represent the extent of the [O iii]-emitting zone when considering a cluster instead of the individual stars (see text).
Current usage metrics show cumulative count of Article Views (full-text article views including HTML views, PDF and ePub downloads, according to the available data) and Abstracts Views on Vision4Press platform.
Data correspond to usage on the plateform after 2015. The current usage metrics is available 48-96 hours after online publication and is updated daily on week days.
Initial download of the metrics may take a while.


