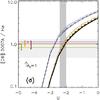
Fig. 8
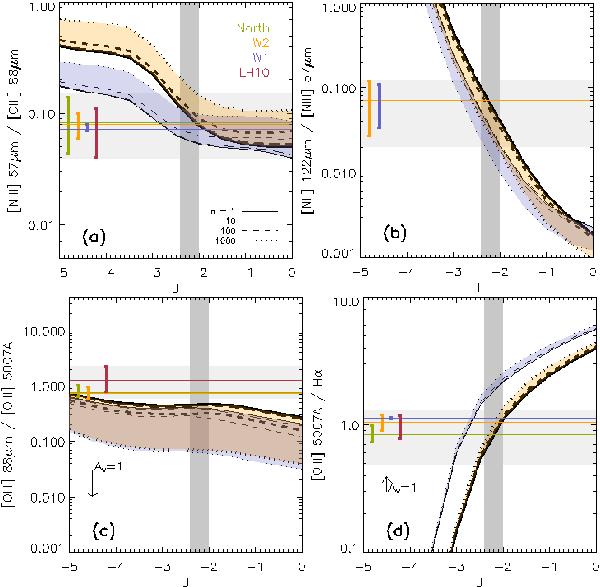
Line flux ratios plotted against the ionization parameter U for radiation temperature of Teff = 40 000 K (orange models) and 45 000 K (blue models). The horizontal lines show the observed values toward specific regions illustrated in previous figures, while the associated vertical bars show the range of values within each region. The light gray horizontal rectangle shows the range of values observed across the entire N 11B nebula. The dark gray vertical rectangle indicates the range of U values agreeing the best with the observed line ratios (see text). The vertical arrow shows the effect of dust extinction on the observations for AV = 1. The W1 region was not covered by the [O iii]opt HST/WFPC2 observation (Fig. 6), and [N ii]122 was only detected by the Herschel/PACS follow-up pointed observations (Fig. 4).
Current usage metrics show cumulative count of Article Views (full-text article views including HTML views, PDF and ePub downloads, according to the available data) and Abstracts Views on Vision4Press platform.
Data correspond to usage on the plateform after 2015. The current usage metrics is available 48-96 hours after online publication and is updated daily on week days.
Initial download of the metrics may take a while.