Fig. 2
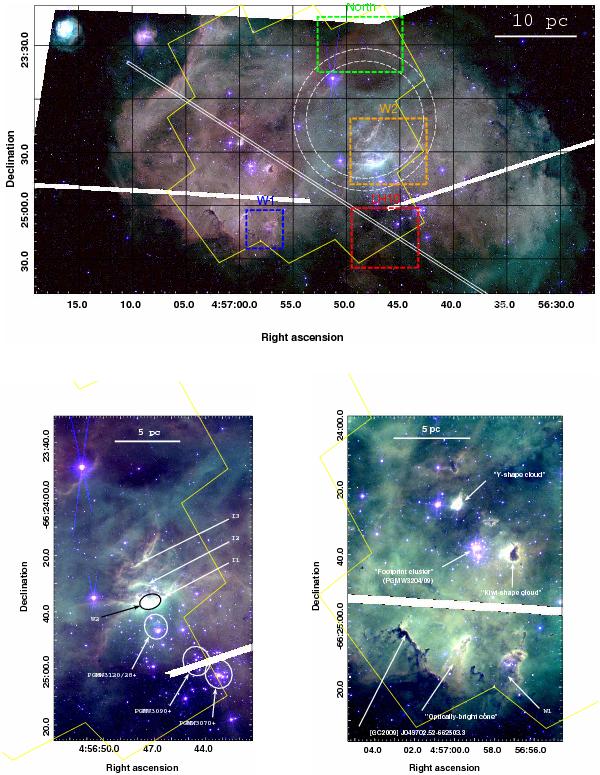
Top − HST/ACS color-composite image of the N 11B region (blue: F814; green: F658N/Hα; red: F660N/[N ii]). Images were downloaded from the Hubble Legacy Archive (http://hla.stsci.edu/) and later stitched with Montage (http://montage.ipac.caltech.edu/). The white stripes correspond to a gap between individual exposures. The yellow polygon indicates the field-of-view of the Herschel/PACS observations ( ≈ 2.3′ × 2.3′). The 4 rectangles in color indicate specific regions discussed in the text. The dashed circles represent the ISO-LWS observation (from 65′′ to 80′′FWHM beam) and the slit represents the optical observation by Tsamis et al. (2001). Bottom − Close-up of the eastern (left panel) and western (right panel) sides. The stellar complexes are labeled as the brightest star with a “+” sign appended.
Current usage metrics show cumulative count of Article Views (full-text article views including HTML views, PDF and ePub downloads, according to the available data) and Abstracts Views on Vision4Press platform.
Data correspond to usage on the plateform after 2015. The current usage metrics is available 48-96 hours after online publication and is updated daily on week days.
Initial download of the metrics may take a while.