Fig. A.3
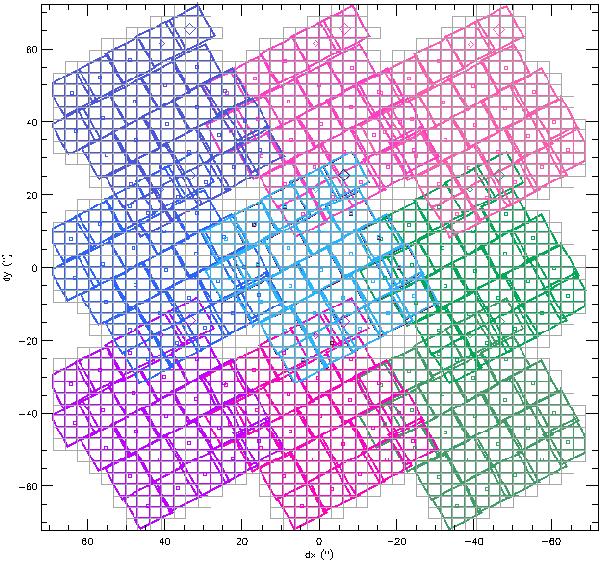
Example of a map projection. The observation (3 × 3 raster footprints) is shown with color symbols. The squares show the spaxel center (5 × 5 spaxels for one raster position), the large diamond shows the spaxels (1, 1), and the dots show the center of the subspaxel (1 / 3 of the size of a spaxel). The information from different spaxels and rasters can be combined to populate the projected grid. Subpixels where there is no coverage are shown as gray squares.
Current usage metrics show cumulative count of Article Views (full-text article views including HTML views, PDF and ePub downloads, according to the available data) and Abstracts Views on Vision4Press platform.
Data correspond to usage on the plateform after 2015. The current usage metrics is available 48-96 hours after online publication and is updated daily on week days.
Initial download of the metrics may take a while.