Fig. A.1
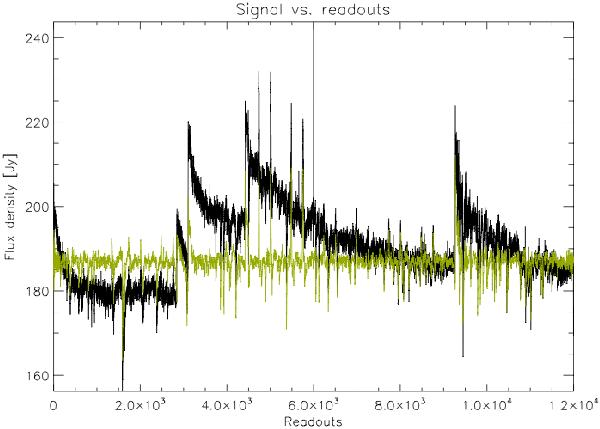
Example of fader transients occurring in unchopped scan observations. The signal is plotted against the readout number for a given spaxel and spectral pixel. The irregular black curve is the unflagged data, while the flat green curve shows the corrected signal. Several transients are observed in this timeline, including the systematic transient after the calibration block on the extreme left.
Current usage metrics show cumulative count of Article Views (full-text article views including HTML views, PDF and ePub downloads, according to the available data) and Abstracts Views on Vision4Press platform.
Data correspond to usage on the plateform after 2015. The current usage metrics is available 48-96 hours after online publication and is updated daily on week days.
Initial download of the metrics may take a while.