Fig. 14
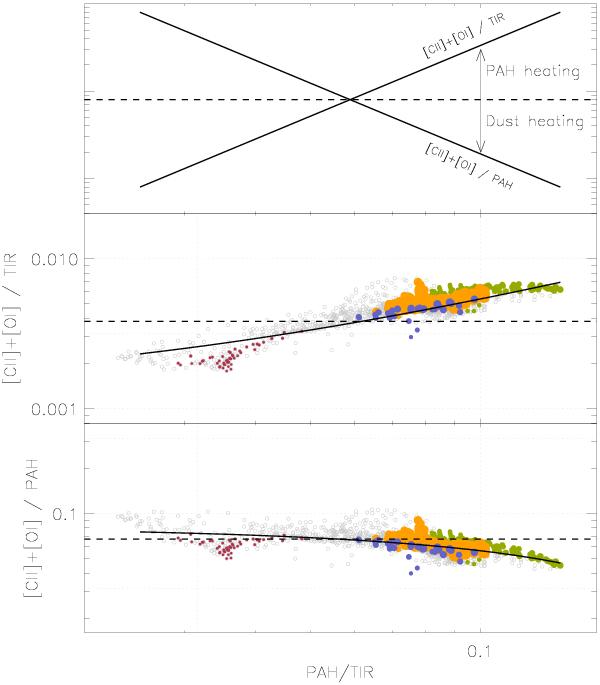
Top − Expected trend between ([C ii]+[O i]63)/(TIR, PAH) against PAH/TIR, assuming that either PAHs or the dust grains traced by TIR dominate the gas heating. Middle and bottom − Pixel-to-pixel correlation between ([C ii]+[O i]63)/(TIR, PAH) and PAH/TIR. The solid line represents the linear regression and the dotted line represents the median value. See Fig. 13 for the plot description.
Current usage metrics show cumulative count of Article Views (full-text article views including HTML views, PDF and ePub downloads, according to the available data) and Abstracts Views on Vision4Press platform.
Data correspond to usage on the plateform after 2015. The current usage metrics is available 48-96 hours after online publication and is updated daily on week days.
Initial download of the metrics may take a while.