Fig. 13
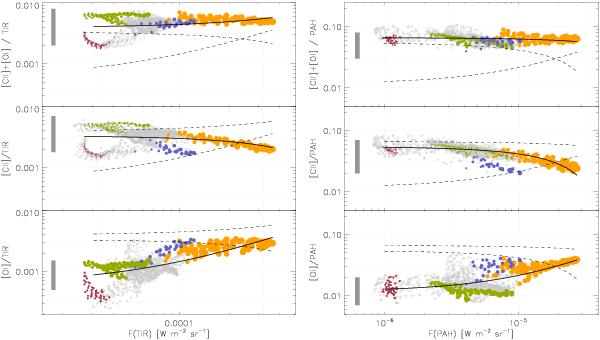
Pixel-to-pixel correlation between the PACS cooling lines ([C ii], [O i]63, and their sum) and 2 quantities used to trace the gas heating, i.e., the TIR emission (left panel) and the PAH emission (right panel). The solid curve represents the linear regression for a given plot and the dashed curves the linear regression of the other ratios for comparison. The colors correspond to specific regions illustrated in Fig. 12. The symbol size is proportional to [C ii]+[O i]63 (top), [C ii] (middle), and [O i]63 (bottom). The gray rectangles on the left side show the values observed by Croxall et al. (2012) in 2 super-solar metallicity nearby galaxies (see text).
Current usage metrics show cumulative count of Article Views (full-text article views including HTML views, PDF and ePub downloads, according to the available data) and Abstracts Views on Vision4Press platform.
Data correspond to usage on the plateform after 2015. The current usage metrics is available 48-96 hours after online publication and is updated daily on week days.
Initial download of the metrics may take a while.