Fig. 12
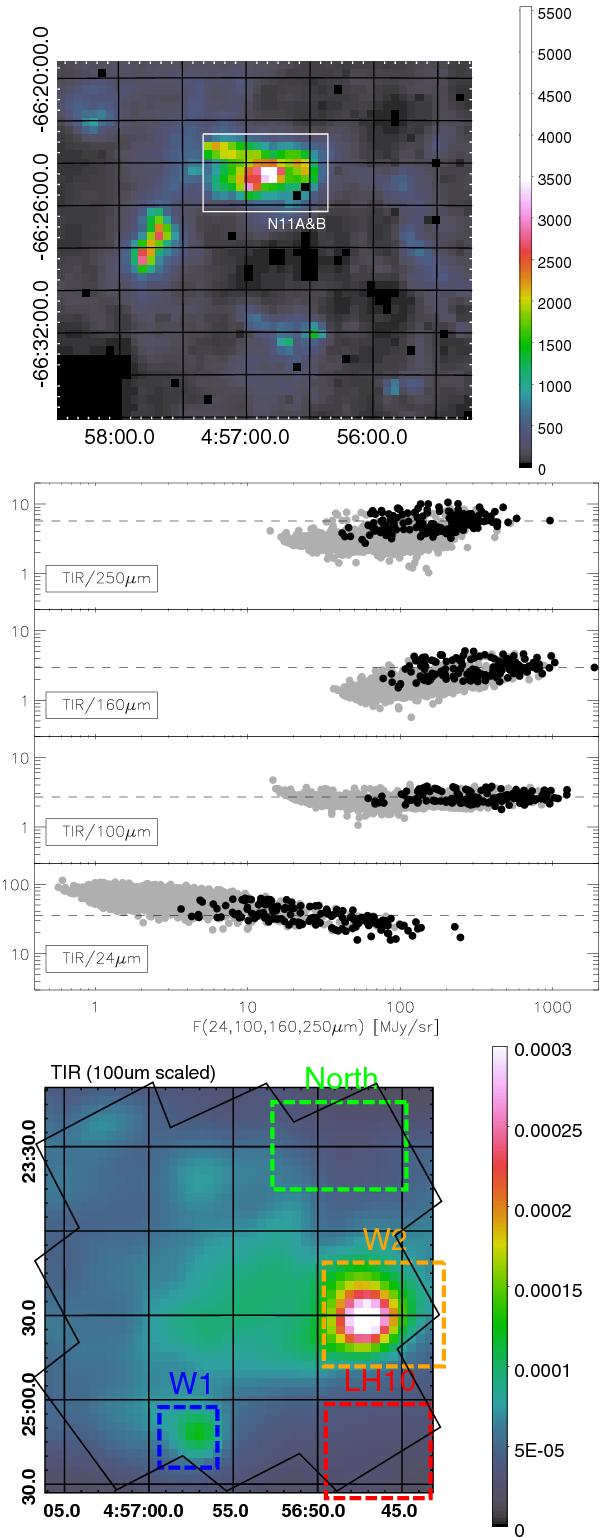
Top − TIR map of N 11 with a resolution of 23″ (see Sect. 6.3). Middle − Correlations between TIR and individual dust continuum bands. Black points correspond to positions in N 11A and N 11B and gray points to the rest of the nebula (see top panel). The dashed line shows the average value. Bottom − TIR map using the 100 μm dust continuum as a tracer. See Fig. 4 for the figure description.
Current usage metrics show cumulative count of Article Views (full-text article views including HTML views, PDF and ePub downloads, according to the available data) and Abstracts Views on Vision4Press platform.
Data correspond to usage on the plateform after 2015. The current usage metrics is available 48-96 hours after online publication and is updated daily on week days.
Initial download of the metrics may take a while.