Fig. 9
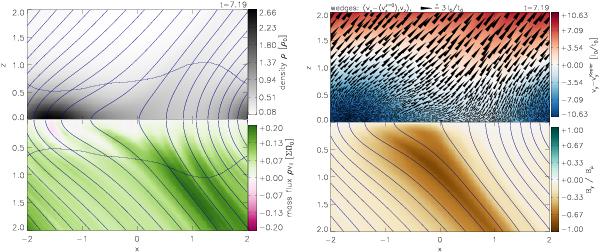
Snapshot of run β1ι50 during the formation of the clump. Left panel: density (black/white) and field-parallel mass flux (green/pink colors). Right panel: azimuthal velocity (sub-Keplerian in blue and super-Keplerian in red) and azimuthal inclination of the magnetic field (brown/turquoise colors). The horizontal velocity, as measured in a frame moving with the mean velocity at the midplane, is visualized with small wedges whose areas are proportional to the velocity modulus. Selected magnetic field lines and the disk’s scale height are overplotted in blue. See Fig. 5c for a snapshot in the evolved state. Two complementary movies are available online.
Current usage metrics show cumulative count of Article Views (full-text article views including HTML views, PDF and ePub downloads, according to the available data) and Abstracts Views on Vision4Press platform.
Data correspond to usage on the plateform after 2015. The current usage metrics is available 48-96 hours after online publication and is updated daily on week days.
Initial download of the metrics may take a while.