Fig. 9
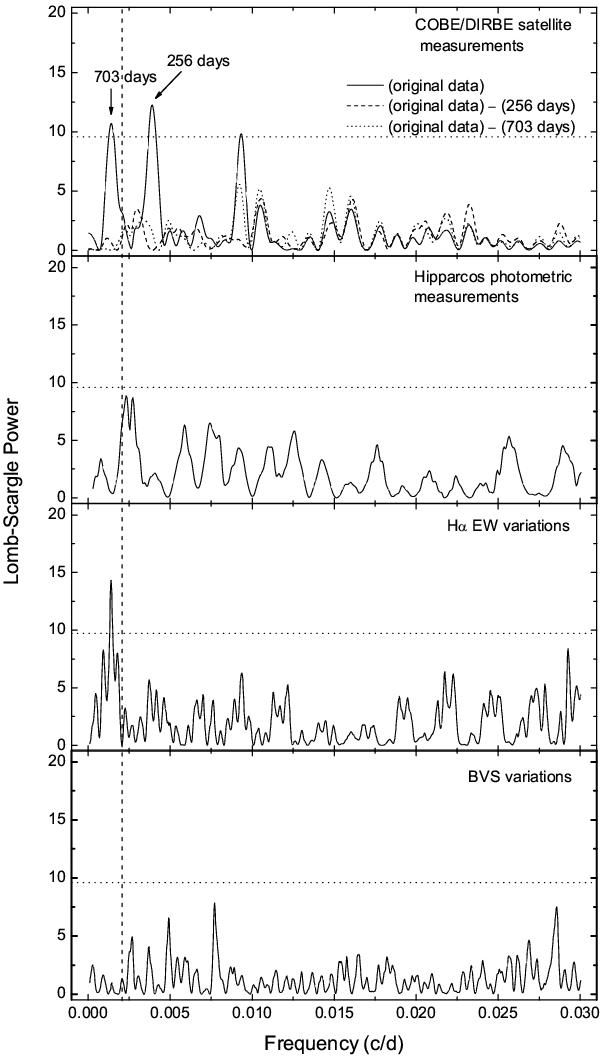
Lomb-Scargle periodograms of the COBE/DIRBE satellite 1.25μ flux intensity measurements, the Hipparcos photometric measurements, the Hα EW variations, and the BVS variations for HD 166141 (top to bottom panel). The vertical dashed line marks the location of the period of 480 days and the horizontal dotted lines indicate an FAP threshold of 1 × 10⁻³ (0.1%). Top panel – the solid line is the Lomb-Scargle periodogram of the COBE/DIRBE satellite 1.25μ flux intensity measurements for 3.5 years. The arrows show the positions of the dominant peaks at  = 0.00390 ± 0.00008 c d-1 (
 = 256.1 ± 5.4 days) and at
  = 0.00142 ± 0.00008 c d-1 (
 = 703.0 ± 39.4 days). The dashed line shows the periodogram of the residuals after removing of the
  day fit from the original data. The dotted line shows the periodogram after removing of the = 703 day fit from the original data.
Current usage metrics show cumulative count of Article Views (full-text article views including HTML views, PDF and ePub downloads, according to the available data) and Abstracts Views on Vision4Press platform.
Data correspond to usage on the plateform after 2015. The current usage metrics is available 48-96 hours after online publication and is updated daily on week days.
Initial download of the metrics may take a while.