Fig. 8
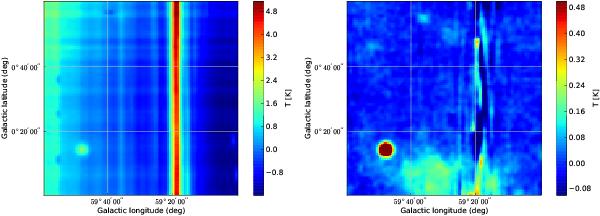
Left panel: map showing 6-cm continuum emission (after full calibration) of the northern part of the dark cloud G 59.5 − 0.2. In the left panel both coverages where simply gridded together. The right panel displays the result of our basket-weaving algorithm applied. Apparently a strong residual artifact remains, which we attribute to the RFI signal at l ≈ 59.3° visible in the left panel.
Current usage metrics show cumulative count of Article Views (full-text article views including HTML views, PDF and ePub downloads, according to the available data) and Abstracts Views on Vision4Press platform.
Data correspond to usage on the plateform after 2015. The current usage metrics is available 48-96 hours after online publication and is updated daily on week days.
Initial download of the metrics may take a while.