Fig. 5
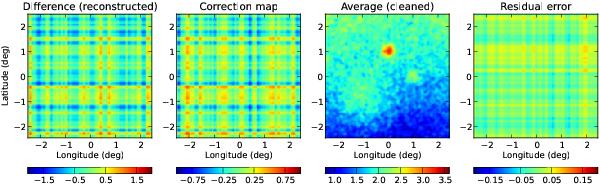
Solving Eq. (12) for the difference map dm,n (Fig. 4 right panel), one obtains a solution for the offset values P. For comparison we show in the left panel the reconstructed difference map (which is basically a noise-free version of the input difference map). Via Eq. (14) one can easily compute a correction map (second panel) that can be subtracted from the original “dirty” map (see Fig. 4 third panel). The result is a cleaned data set (third panel), from which image artifacts are visually removed. The right panel shows the difference of the clean and cleaned map. Residual stripes appear, but they are suppressed by about an order of magnitude compared to the correction map (note the different intensity scale).
Current usage metrics show cumulative count of Article Views (full-text article views including HTML views, PDF and ePub downloads, according to the available data) and Abstracts Views on Vision4Press platform.
Data correspond to usage on the plateform after 2015. The current usage metrics is available 48-96 hours after online publication and is updated daily on week days.
Initial download of the metrics may take a while.