Fig. 4
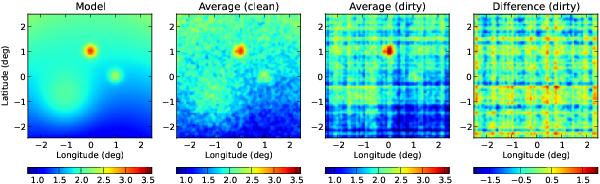
Simulated maps. The left panel contains the input sky model. From this, two coverages were drawn and noise was added as well as a random offset for each scan line. The middle panels show the average of both maps (for the clean and dirty case, the former with and the latter without offsets applied), the right panel the difference dm,n according to Eq. (8). Note that different intensity scales were used.
Current usage metrics show cumulative count of Article Views (full-text article views including HTML views, PDF and ePub downloads, according to the available data) and Abstracts Views on Vision4Press platform.
Data correspond to usage on the plateform after 2015. The current usage metrics is available 48-96 hours after online publication and is updated daily on week days.
Initial download of the metrics may take a while.