Fig. 3
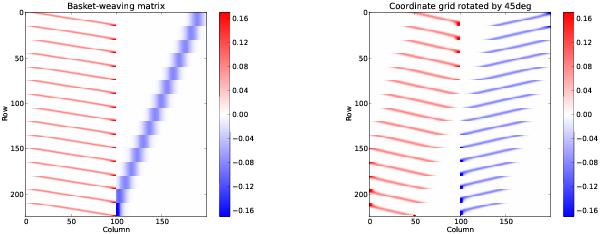
Left panel: Basket-weaving matrix A for a small test case (2 × 100 strictly orthogonal scan lines, gridded into a map of 15 × 15 pixels). The left/right part of the matrix (columns 1 to 100/columns 101 to 200) links the offsets (100 each) associated with first/second coverage to the difference map (flattened to form the vector D). Right panel: for the same example the coordinate grid was rotated by 45°. Evidently, now different offsets contribute to a pixel compared to the left panel.
Current usage metrics show cumulative count of Article Views (full-text article views including HTML views, PDF and ePub downloads, according to the available data) and Abstracts Views on Vision4Press platform.
Data correspond to usage on the plateform after 2015. The current usage metrics is available 48-96 hours after online publication and is updated daily on week days.
Initial download of the metrics may take a while.