Fig. 10
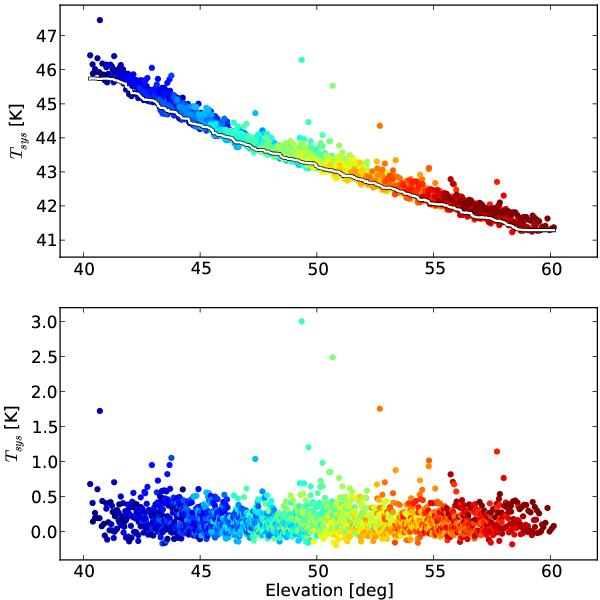
Upper panel: the system temperature of a single feed as a function of elevation. To illustrate that multiple scan lines contribute at a given elevation, each scan line was color-coded. The line shows the result of the percentile filter (see text). Lower panel: the residual brightness temperatures after the subtraction of the percentile filter. No dependence on elevation is evident.
Current usage metrics show cumulative count of Article Views (full-text article views including HTML views, PDF and ePub downloads, according to the available data) and Abstracts Views on Vision4Press platform.
Data correspond to usage on the plateform after 2015. The current usage metrics is available 48-96 hours after online publication and is updated daily on week days.
Initial download of the metrics may take a while.