Fig. 1
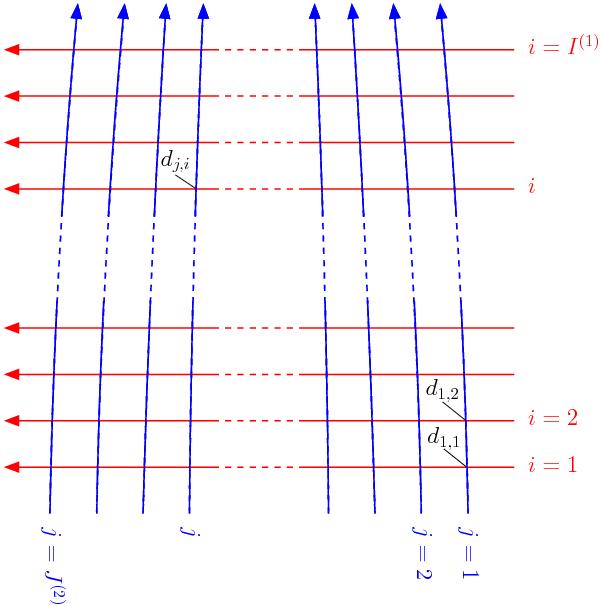
Geometry of the basket-weaving problem. Usually two (quasi) orthogonal maps are observed in so-called on-the-fly-mode (OTF) where the telescope constantly drives across the area. Each of these scan lines is visualized by an arrow (red: first coverage in longitudinal direction, blue: second lateral coverage). At the crossing points dj,i the contribution of the true brightness temperature should be the same for both coverages, while baseline (offsets) may differ. The distance between two recorded samples (dumps) on a scan line is often smaller than the separation of the scan lines. Depending on the projection and coordinate system chosen, the scan lines may not be plane-parallel.
Current usage metrics show cumulative count of Article Views (full-text article views including HTML views, PDF and ePub downloads, according to the available data) and Abstracts Views on Vision4Press platform.
Data correspond to usage on the plateform after 2015. The current usage metrics is available 48-96 hours after online publication and is updated daily on week days.
Initial download of the metrics may take a while.