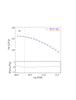
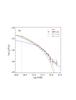
Fig. 2
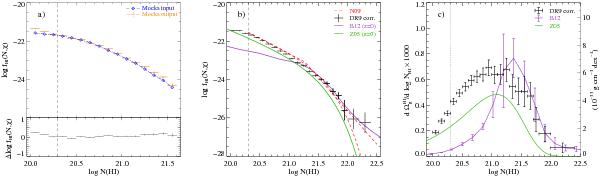
Column density distribution functions from synthetic (left) and real data (centre) at ⟨z⟩ = 2.5. Horizontal bars represent the bin over which f(NHI,χ) is calculated and vertical error bars represent Poissonian uncertainty. The difference between output and input mock distributions is shown at the bottom of panel a). The double power-law and Γ-function fits to the DR7 distribution (N09, ⟨z⟩ = 2.9) are shown as red dashed lines. f(NHI,χ)(z = 0) are taken from Braun (2012, purple) and Zwaan et al. (2005, green). Right: the contribution of DLAs in a given N(H i) range to the total mass census of neutral gas. DR9 values are corrected for systematics.
Current usage metrics show cumulative count of Article Views (full-text article views including HTML views, PDF and ePub downloads, according to the available data) and Abstracts Views on Vision4Press platform.
Data correspond to usage on the plateform after 2015. The current usage metrics is available 48-96 hours after online publication and is updated daily on week days.
Initial download of the metrics may take a while.