Fig. 2
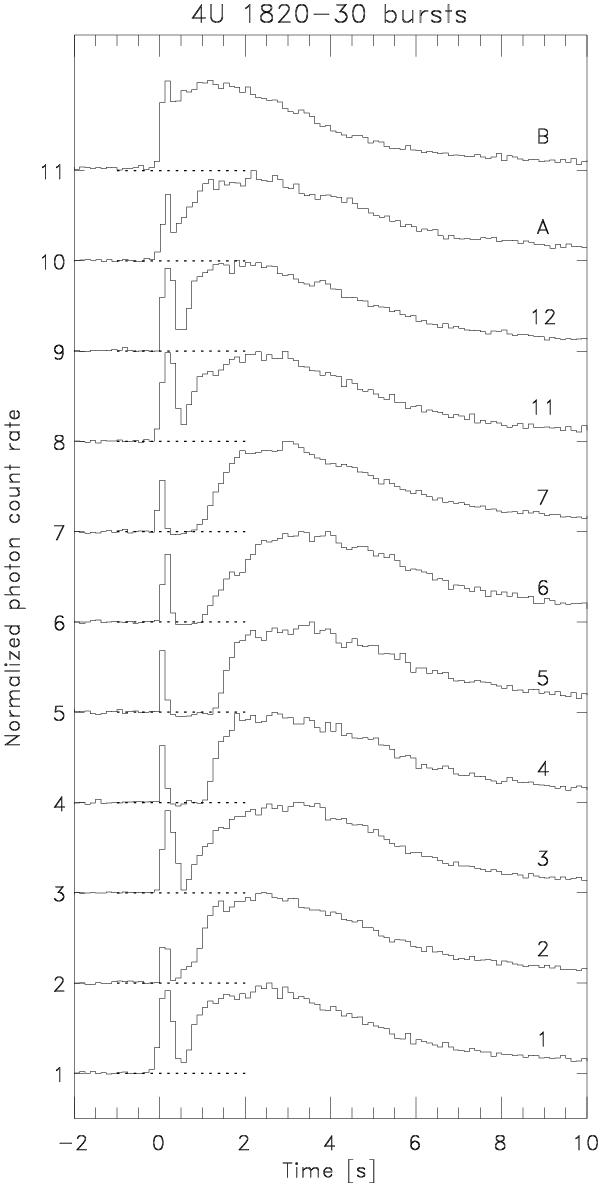
Measured photon rate time histories for the 9 PCA bursts, from bottom to top chronologically, supplemented with the 2 PCA bursts that are lowest in the color–color diagram (Fig. 4). The subtracted background level is measured from a 150 s time interval prior to the burst and the curves have been normalized to the peak rate. For guidance, the zero level has been indicated by a dotted line.
Current usage metrics show cumulative count of Article Views (full-text article views including HTML views, PDF and ePub downloads, according to the available data) and Abstracts Views on Vision4Press platform.
Data correspond to usage on the plateform after 2015. The current usage metrics is available 48-96 hours after online publication and is updated daily on week days.
Initial download of the metrics may take a while.