Fig. 3
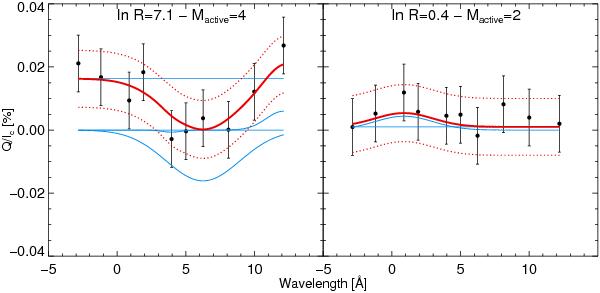
Application of the signal detection scheme to the linear polarization signals in the Mg ii h and k lines observed by Henze & Stenflo (1987). The dots display the observations, with their associated Gaussian error bars. The solid red curve is the mean of the predictive distribution, together with the error bars in red dotted lines. The blue curves display the contribution of each individual kernel function.
Current usage metrics show cumulative count of Article Views (full-text article views including HTML views, PDF and ePub downloads, according to the available data) and Abstracts Views on Vision4Press platform.
Data correspond to usage on the plateform after 2015. The current usage metrics is available 48-96 hours after online publication and is updated daily on week days.
Initial download of the metrics may take a while.