Fig. 2
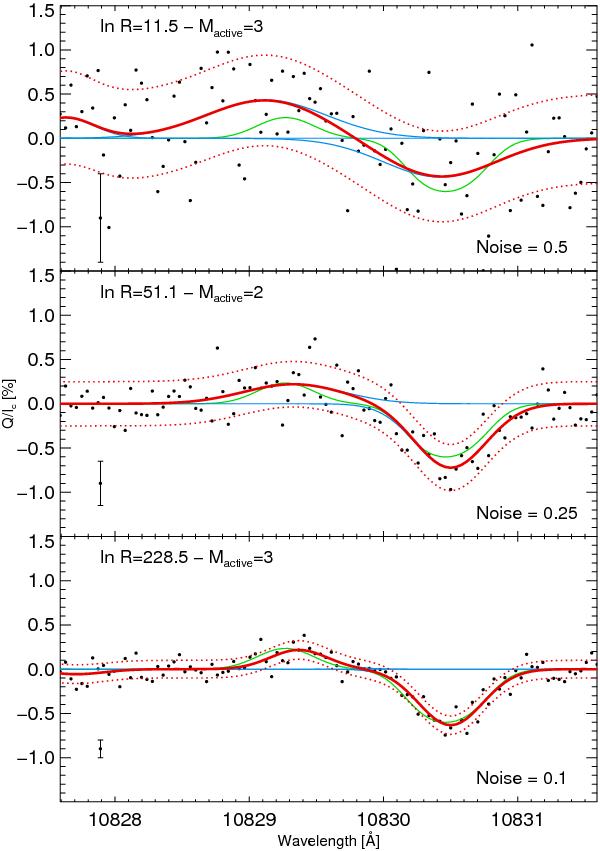
Example of the Bayesian signal detection scheme applied to a synthetic spectrum of the He i 10 830 Å multiplet obtained with Hazel (Asensio Ramos et al. 2008). The dots display the observations with increasingly higher Gaussian noise. To avoid cluttering, we only show one error bar. The solid red curve is the mean of the predictive distribution, together with the error bars shown as red dotted lines. The blue curves display the contribution of each individual kernel function, and the green curve is the original profile.
Current usage metrics show cumulative count of Article Views (full-text article views including HTML views, PDF and ePub downloads, according to the available data) and Abstracts Views on Vision4Press platform.
Data correspond to usage on the plateform after 2015. The current usage metrics is available 48-96 hours after online publication and is updated daily on week days.
Initial download of the metrics may take a while.