Fig. 4
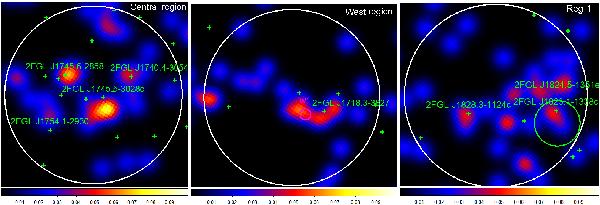
Photon-count maps of the “Central” (left) and “West” (middle) regions at 120−140 GeV and the “Reg 1” region at 100−120 GeV energy bands smoothed with a 0.25° Gaussian kernel ( ≈ 95% Fermi PSF at 100 GeV). The corresponding regions from Tempel et al. (2012) and Boyarsky et al. (2012) are shown with white circles, while the sources from the Fermi LAT two-year catalog are shown with green crosses.
Current usage metrics show cumulative count of Article Views (full-text article views including HTML views, PDF and ePub downloads, according to the available data) and Abstracts Views on Vision4Press platform.
Data correspond to usage on the plateform after 2015. The current usage metrics is available 48-96 hours after online publication and is updated daily on week days.
Initial download of the metrics may take a while.