Fig. 2
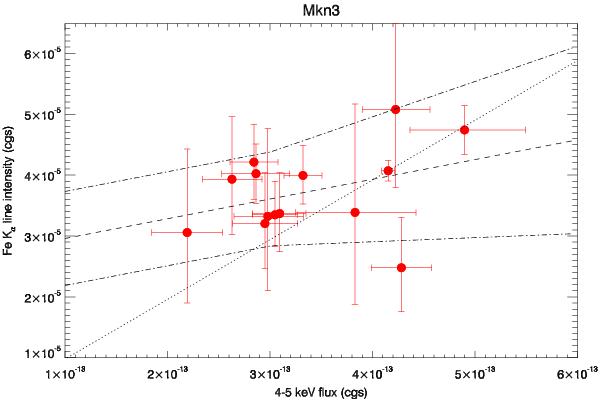
Intensity of the Fe Kα against the observed flux in the 4–5 keV energy band. The dotted line indicates the locus of constant line EW, normalized to the value measured during the deepest XMM-Newton observation (October 2000). The dashed line indicates the linear best fit, whereas the dot-dashed lines indicate the envelope corresponding to the 1σ uncertainties on the best-fit parameters.
Current usage metrics show cumulative count of Article Views (full-text article views including HTML views, PDF and ePub downloads, according to the available data) and Abstracts Views on Vision4Press platform.
Data correspond to usage on the plateform after 2015. The current usage metrics is available 48-96 hours after online publication and is updated daily on week days.
Initial download of the metrics may take a while.