Fig. 9
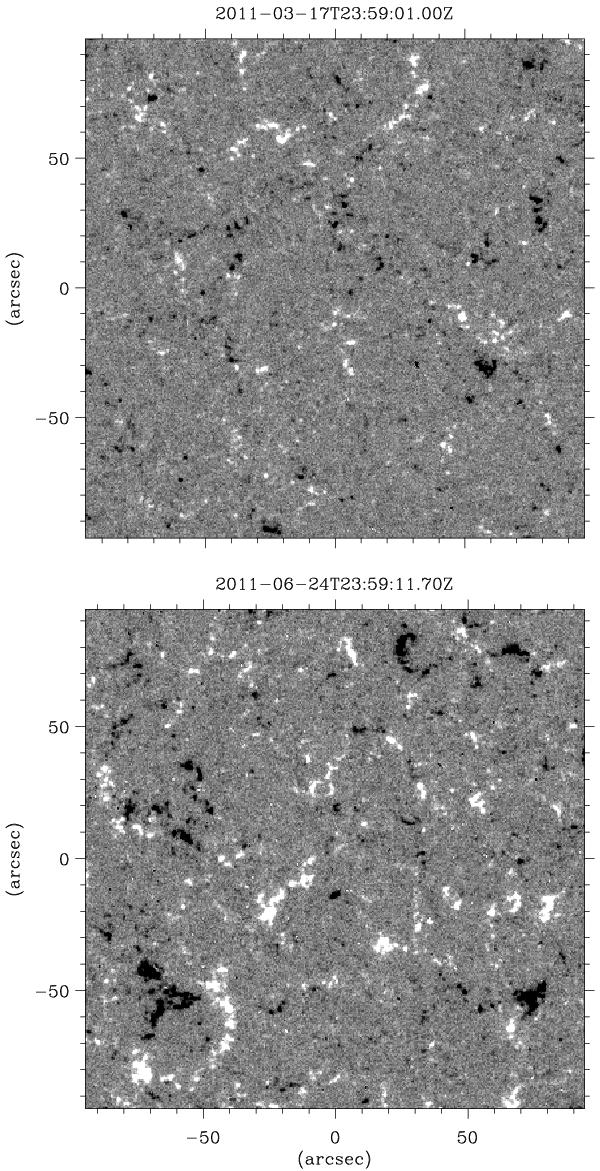
Comparison of the disk-center portions (| x|, |y| < 0.1 r⊙) of two HMI magnetograms, recorded at times 2011.2086 (upper panel) and 2011.4796 (lower panel), when the average of the unsigned vertical flux density was 3.06 and 6.65 G, respectively. The upper panel thus represents the case when the basal flux density level is approximately reached. The grey-scale cuts are at ± 50 G in both panels.
Current usage metrics show cumulative count of Article Views (full-text article views including HTML views, PDF and ePub downloads, according to the available data) and Abstracts Views on Vision4Press platform.
Data correspond to usage on the plateform after 2015. The current usage metrics is available 48-96 hours after online publication and is updated daily on week days.
Initial download of the metrics may take a while.