Fig. 8
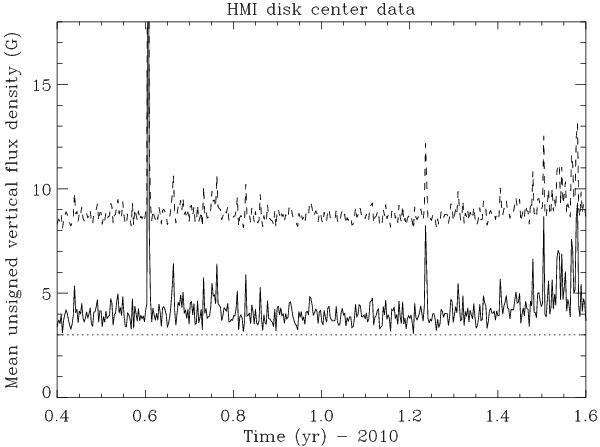
Time series (2010.4–2011.6) of the noise-affected average unsigned vertical flux density (dashed curve) and its counterpart after noise removal (solid curve), representing the disk center region (r/r⊙ < 0.1). The solid curve never dips below the 3.0 G level, which can be interpreted as the basal flux density at the HMI resolution of 1 arcsec.
Current usage metrics show cumulative count of Article Views (full-text article views including HTML views, PDF and ePub downloads, according to the available data) and Abstracts Views on Vision4Press platform.
Data correspond to usage on the plateform after 2015. The current usage metrics is available 48-96 hours after online publication and is updated daily on week days.
Initial download of the metrics may take a while.