Fig. 5
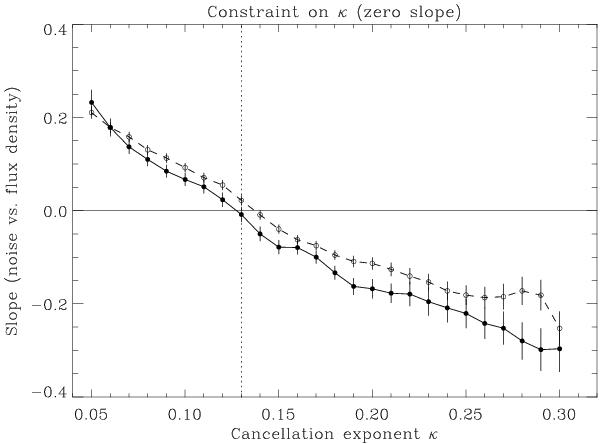
Regression line slopes with error bars for the point populations in diagrams of the type of Fig. 4, based on model fitting with different fixed values for the cancellation exponent κ. The filled circles and solid line represent magnetograms with 5-min integration, while the open circles and dashed line represent magnetograms with 1-min integration. Only zero slope is physically acceptable, which occurs when κ = 0.13 (marked by the vertical dotted line).
Current usage metrics show cumulative count of Article Views (full-text article views including HTML views, PDF and ePub downloads, according to the available data) and Abstracts Views on Vision4Press platform.
Data correspond to usage on the plateform after 2015. The current usage metrics is available 48-96 hours after online publication and is updated daily on week days.
Initial download of the metrics may take a while.