Fig. 4
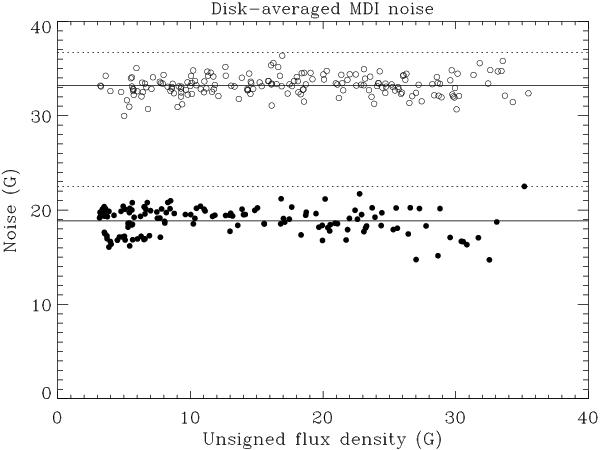
Standard deviation σ of the Gaussian noise distribution (vertical axis) vs. noise-free average unsigned vertical flux density, determined from least-squares fits to the randomly selected 320 MDI magnetograms, assuming a cancellation exponent κ = 0.13. The filled circles have been obtained from magnetograms recorded with 5-min integration, the open circles from magnetograms with 1-min integration. The solid horizontal lines at 18.8 and 33.2 G represent the average values of σ for the two populations. For comparison the corresponding upper limits to the noise levels as derived from the analysis of Liu et al. (2012) are given as the dotted lines.
Current usage metrics show cumulative count of Article Views (full-text article views including HTML views, PDF and ePub downloads, according to the available data) and Abstracts Views on Vision4Press platform.
Data correspond to usage on the plateform after 2015. The current usage metrics is available 48-96 hours after online publication and is updated daily on week days.
Initial download of the metrics may take a while.