Fig. 3
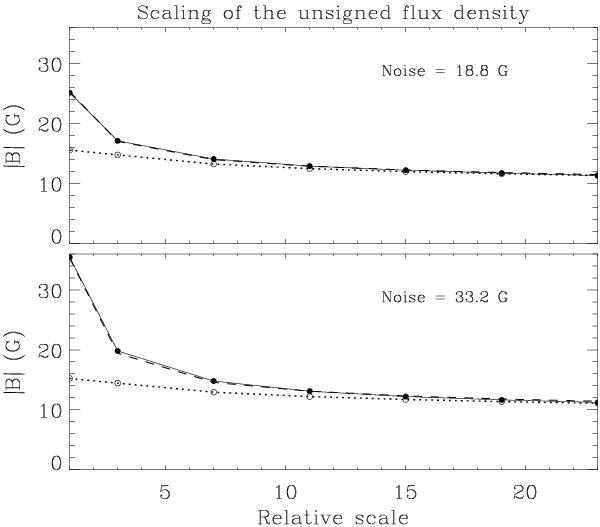
Average unsigned vertical flux density vs. relative size (in pixel units) of the smoothing window, illustrated for two representative magnetograms, one obtained with 5-min integration (upper panel), the other with 1-min integration (lower panel). The solid curves represent the observed, noise-affected values Bapp, the dotted curves the noise-free values Bave, while the dashed curves are obtained through combination of Bave with the noise σ according to the model described by Eqs. (3) and (4).
Current usage metrics show cumulative count of Article Views (full-text article views including HTML views, PDF and ePub downloads, according to the available data) and Abstracts Views on Vision4Press platform.
Data correspond to usage on the plateform after 2015. The current usage metrics is available 48-96 hours after online publication and is updated daily on week days.
Initial download of the metrics may take a while.