Fig. 10
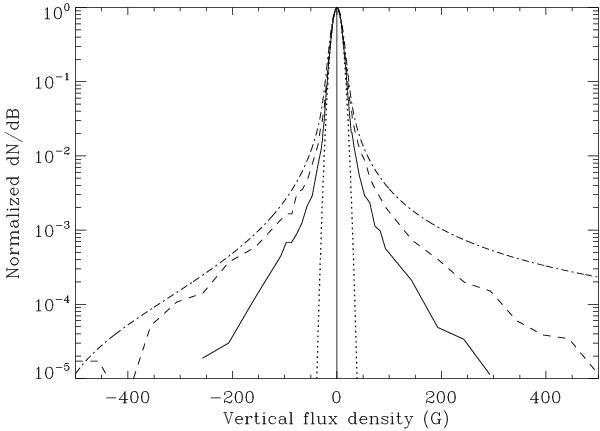
Amplitude-normalized PDFs for the two magnetograms in Fig. 9 (solid line for the upper magnetogram, dashed line for the lower) and for the Gaussian noise distribution with σ = 8.0 G (dotted line). For comparison we have also plotted as the dash-dotted line the analytical representation of the PDF from the Hinode quiet-sun analysis of Stenflo (2010), after having convolved it with the σ = 8.0 G Gaussian to make it comparable to the HMI PDFs.
Current usage metrics show cumulative count of Article Views (full-text article views including HTML views, PDF and ePub downloads, according to the available data) and Abstracts Views on Vision4Press platform.
Data correspond to usage on the plateform after 2015. The current usage metrics is available 48-96 hours after online publication and is updated daily on week days.
Initial download of the metrics may take a while.