Fig. 1
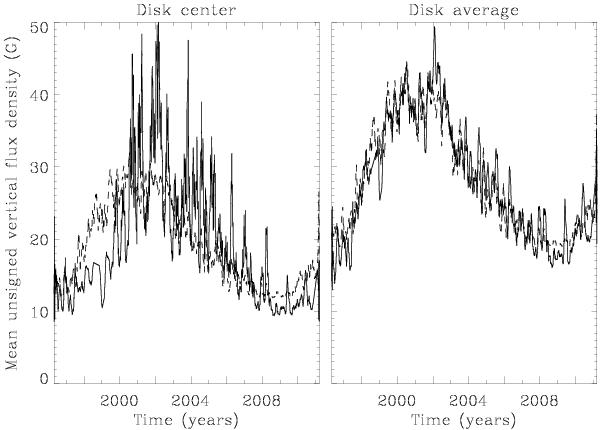
Time series of the average of the unsigned vertical flux density, smoothed with a 1-month wide time window (solid lines). Left panel: averaging over the disk region r/r⊙ < 0.1. Right panel: averaging over the disk region r/r⊙ < 0.9. The dashed curves use a second-order polynomial in the sunspot number (also smoothed with a 1-month time window) to fit the solid curves. The fit gets tighter as the disk averaging area increases.
Current usage metrics show cumulative count of Article Views (full-text article views including HTML views, PDF and ePub downloads, according to the available data) and Abstracts Views on Vision4Press platform.
Data correspond to usage on the plateform after 2015. The current usage metrics is available 48-96 hours after online publication and is updated daily on week days.
Initial download of the metrics may take a while.