Fig. 7
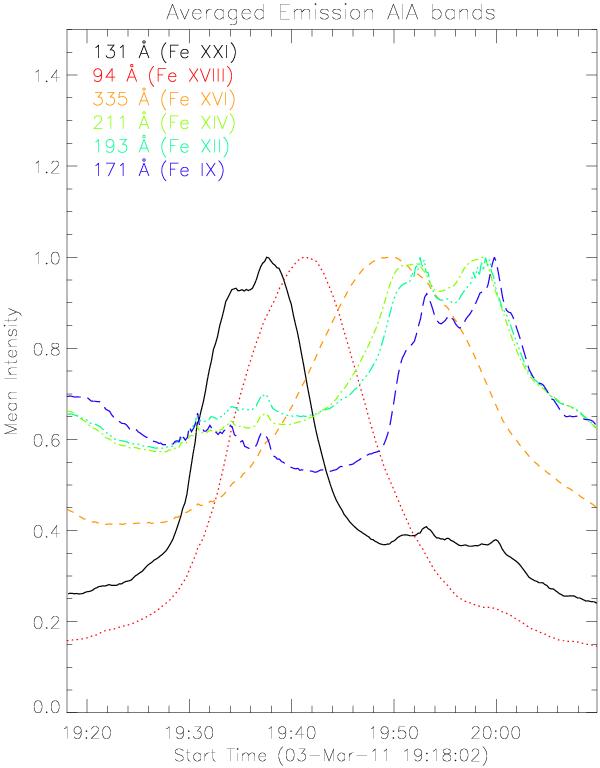
AIA channels average emission on 2011 Mar. 03 in the interval 19:30 to 20:00 UT from the following AIA channels (1) 131 Å (full black line); (2) 94 Å (red dotted line); (3) 335 Å (orange dashed line); (4) 211 Å (green dashed-dotted line); (5) 193 Å (dark green dashed-triple dotted line); (6) 171 Å (blue long-dashed line). Each averaged emission is normalised to its maximum in the time interval shown in the plot.
Current usage metrics show cumulative count of Article Views (full-text article views including HTML views, PDF and ePub downloads, according to the available data) and Abstracts Views on Vision4Press platform.
Data correspond to usage on the plateform after 2015. The current usage metrics is available 48-96 hours after online publication and is updated daily on week days.
Initial download of the metrics may take a while.