Fig. 3
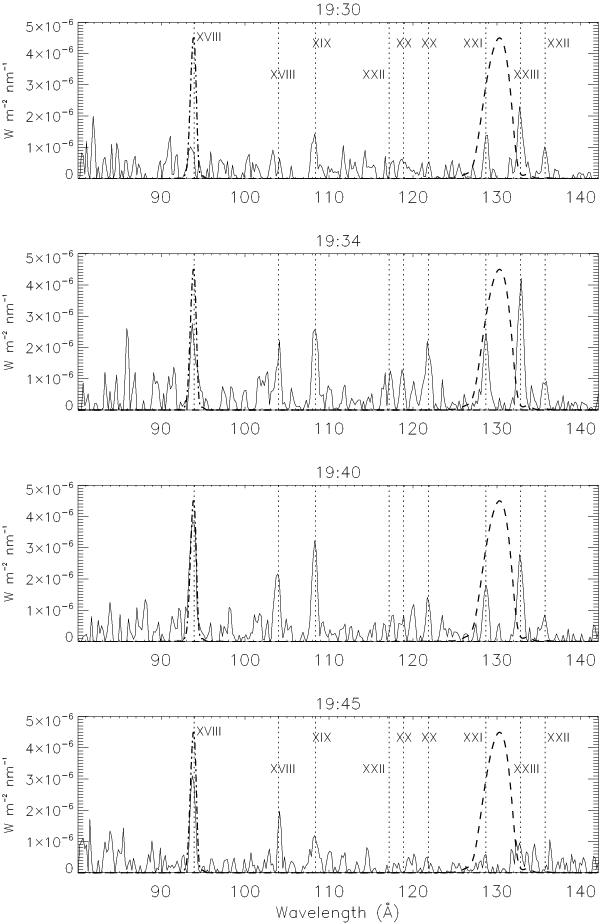
EVE spectra during the flare on 2011 Mar. 03 after subtracting a pre-flare emission, (in W m-2 nm-1). Overplotted as dotted lines are the following iron lines: Fe xviii 93.93 Å, Fe xviii 103.97 Å, Fe xix 108.37 Å, Fe xxii 117.17 Å, Fe xx 118.88 Å, Fe xx 121.845 Å, Fe xxi 128.7 Å, Fe xxiii 132.8 Å, Fe xxii 135.755 Å. The AIA 94 (dashed-dotted) and 131 (dashed) Å channel responses are indicated on each graph.
Current usage metrics show cumulative count of Article Views (full-text article views including HTML views, PDF and ePub downloads, according to the available data) and Abstracts Views on Vision4Press platform.
Data correspond to usage on the plateform after 2015. The current usage metrics is available 48-96 hours after online publication and is updated daily on week days.
Initial download of the metrics may take a while.