Free Access
Fig. 12
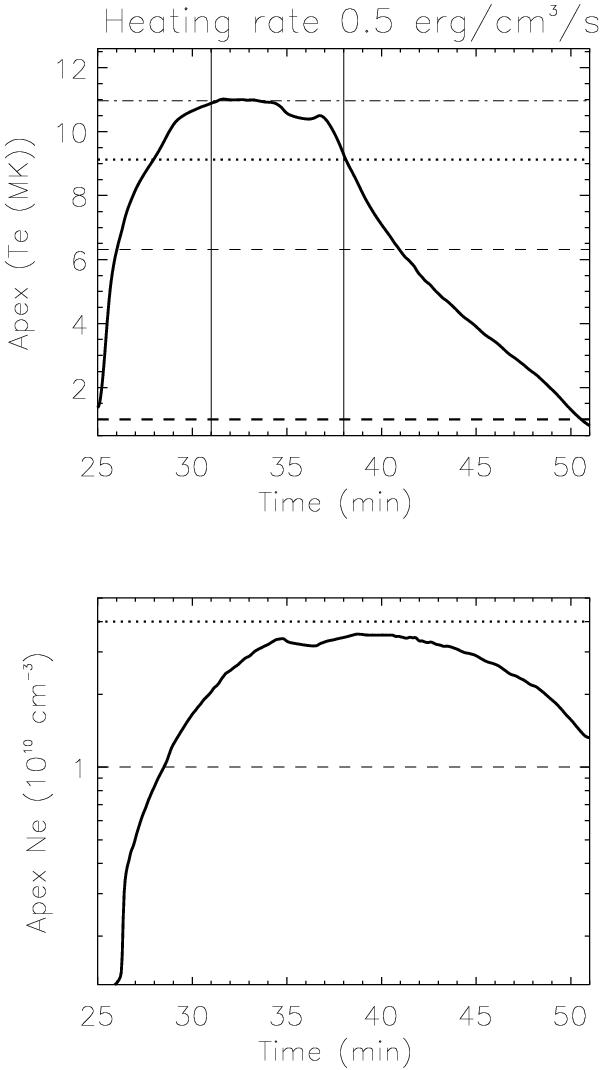
HYDRAD apex temperature (top panel) and apex density (lower panel) of flaring loop plasma assuming that the start of the simulation corresponds to 19:25 UT. The vertical lines at 19:31 and 19:38 UT are overplotted to compare with observational results in Sect. 2.3 at the same times.
Current usage metrics show cumulative count of Article Views (full-text article views including HTML views, PDF and ePub downloads, according to the available data) and Abstracts Views on Vision4Press platform.
Data correspond to usage on the plateform after 2015. The current usage metrics is available 48-96 hours after online publication and is updated daily on week days.
Initial download of the metrics may take a while.