Fig. 10
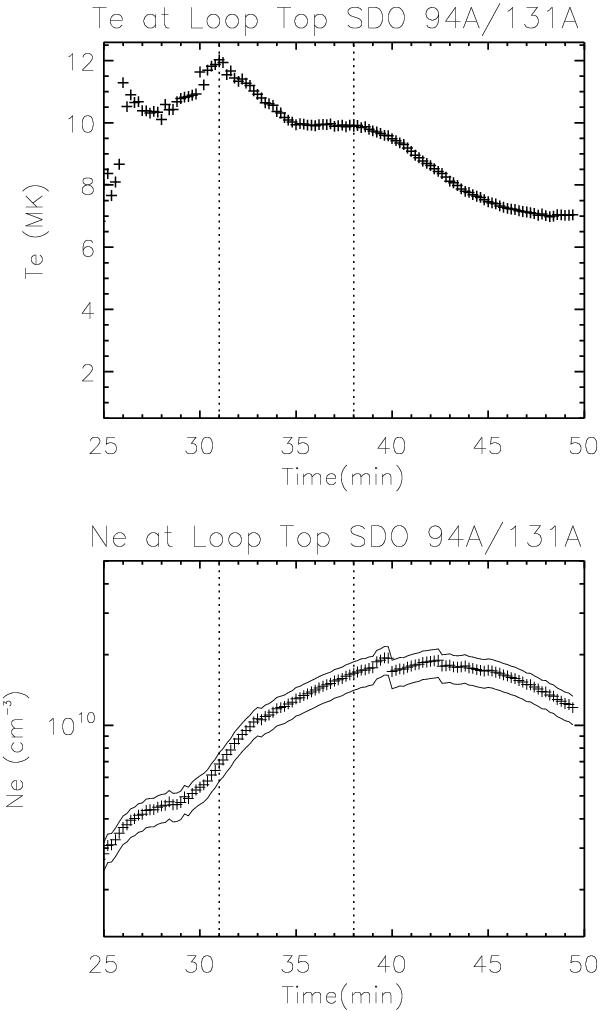
Top panel: AIA temperature estimation on 2011 Mar. 03 starting on 19:25 UT at the loop top of the main set of loops as a function of time, obtained from the ratio of 94 Å to the 131 Å channel. Lower panel: density estimation as a function of time. Overplotted dotted lines at 19:31 and 19:38 UT provide comparison with the simulation results in Sect. 3.
Current usage metrics show cumulative count of Article Views (full-text article views including HTML views, PDF and ePub downloads, according to the available data) and Abstracts Views on Vision4Press platform.
Data correspond to usage on the plateform after 2015. The current usage metrics is available 48-96 hours after online publication and is updated daily on week days.
Initial download of the metrics may take a while.