Fig. 7
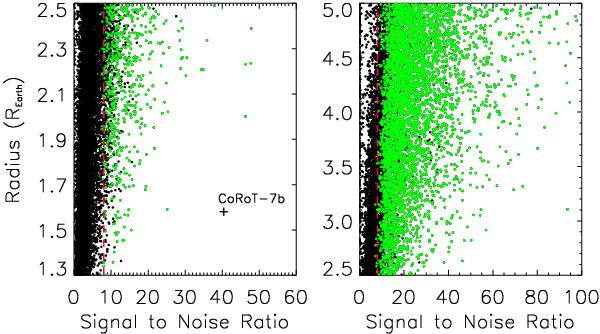
Radius of the simulated planets as a function of the S/N of their transits. As in Fig. 5, green and black dots indicate the identified and missed planets, respectively. The vast majority of the discovered transits have S/N > 8 (red dashed line). Note that the x-scale in the left and right panels is different. See text for discussion about the transits with S/N ≥ 15 that should be easily detectable but were missed in our blind test.
Current usage metrics show cumulative count of Article Views (full-text article views including HTML views, PDF and ePub downloads, according to the available data) and Abstracts Views on Vision4Press platform.
Data correspond to usage on the plateform after 2015. The current usage metrics is available 48-96 hours after online publication and is updated daily on week days.
Initial download of the metrics may take a while.