Fig. 3
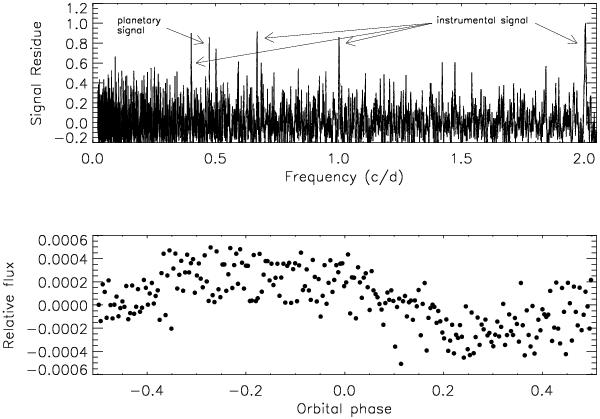
Top panel: BLS spectrum of the filtered light curve LRa01_E1_2996, containing simulated transits by a super-Earth with orbital period P = 2.1 days. The 12 h instrumental effect overcomes the planetary signal, which impedes its detection. Bottom panel: phase-folded light curve at the period and epoch found by the BLS, displaying the quasi-sinusoidal variation caused by the Earth’s perturbation (see text for more details).
Current usage metrics show cumulative count of Article Views (full-text article views including HTML views, PDF and ePub downloads, according to the available data) and Abstracts Views on Vision4Press platform.
Data correspond to usage on the plateform after 2015. The current usage metrics is available 48-96 hours after online publication and is updated daily on week days.
Initial download of the metrics may take a while.