Fig. 2
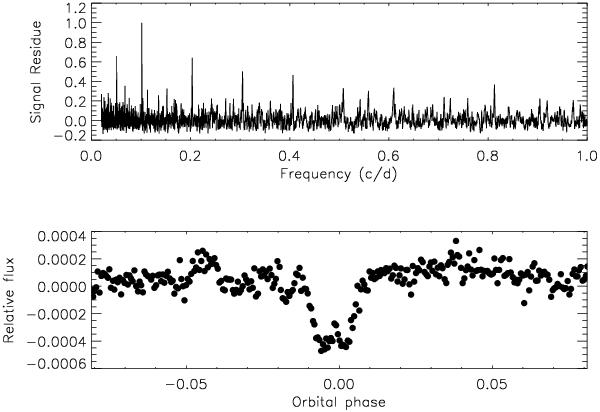
Top panel: BLS spectrum of the filtered light curve LRc01_E1_0331, containing simulated transits by a super-Earth with orbital period P = 9.8 days (see bottom panel of Fig. 1). The highest peak corresponds to the inserted transit signal, which is thus easily detected. Its harmonics are also clearly visible. Bottom panel: phase-folded light curve at the period and epoch found by the BLS (Sect. 3.1.g).
Current usage metrics show cumulative count of Article Views (full-text article views including HTML views, PDF and ePub downloads, according to the available data) and Abstracts Views on Vision4Press platform.
Data correspond to usage on the plateform after 2015. The current usage metrics is available 48-96 hours after online publication and is updated daily on week days.
Initial download of the metrics may take a while.