Fig. 1
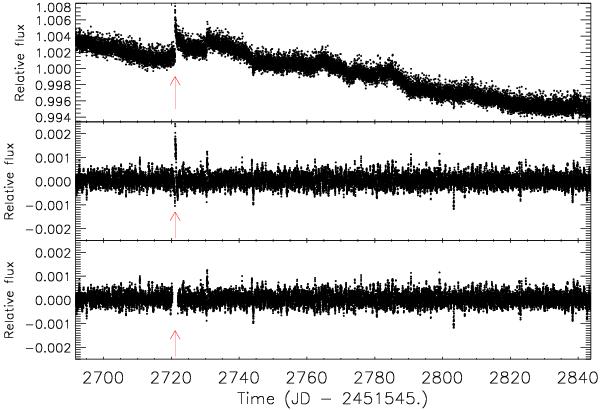
Top panel: the CoRoT light curve LRc01_E1_0331, filtered from cosmic rays (Sect. 3.1.a), containing simulated transits of a super-Earth with an orbital period of 9.8 days. The red arrow indicates the jump produced by a hot pixel and correctly identified by our pipeline. Middle panel: high- and low-pass filtered light curve after steps b), c), and d). Planetary transits by the super-Earth are not visible to the naked eye. Other artificial dips are produced by undetected small discontinuities. Bottom panel: light curve after removal of data points in the vicinity of the identified discontinuity (Sect. 3.1.e).
Current usage metrics show cumulative count of Article Views (full-text article views including HTML views, PDF and ePub downloads, according to the available data) and Abstracts Views on Vision4Press platform.
Data correspond to usage on the plateform after 2015. The current usage metrics is available 48-96 hours after online publication and is updated daily on week days.
Initial download of the metrics may take a while.